Doji Pattern
More Chart Patterns
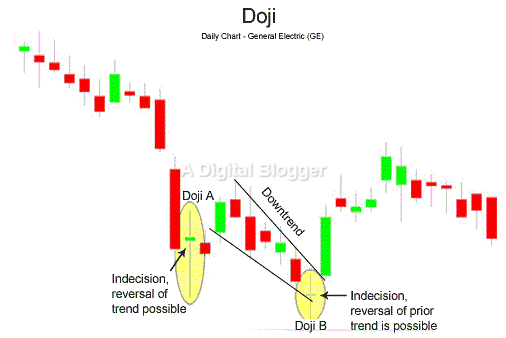
A Doji pattern chiefly appears at the beginning or towards the end of a trend line. Sometimes, a Doji pattern is interpreted as a change in the direction of price, and at other times, it is perceived as a continuation pattern.
The indecision of a Doji pattern is inherently tied to the performance of bears and bulls in stock markets.
Doji Pattern Meaning
Trading financial assets like derivatives, bonds and stocks can become much simpler through technical analysis of stocks.
Candlestick charts are a popular form of stock data analysis and the Doji pattern helps traders identify important aspects of indecision in the stock market space. These patterns are especially helpful in markets with conspicuous or attractive trends.
The most important feature of a Doji pattern is that the opening price is equivalent to its closing price.
In other words, the Doji pattern represents a market state which falls back to its opening price level by the end of the day. As an example, assume that prices were pushed higher by the bulls at its opening stage, followed by a lowering of prices by the bears. This trend was pulled back to its original state by the bulls.
Such a scenario is appropriately shown using the Doji pattern.
The reverse could also be true, but indecision, rather than a reversal is characteristic to this pattern.
Doji Pattern in the Stock Market
The Doji pattern can lead to high profits while trading stocks.
One of the most basic objectives of trading is to find the most appropriate time to execute a buy or sell decision. It is not uncommon for investors to scan more than fifty candlesticks in order to identify trend reversals. Investor perceptions have a major influence on stock prices.
Huh!

The versatility of the Doji pattern is appreciated by all types of investors and valid for all time frames.
An appearance of a Doji pattern has important implications for investors. At the top of a trend, it signals them to sell immediately. On the other hand, when it is found towards the end of a trend, it indicates expected to buy signals for the next day.
What to Look for in Doji Patterns?
Investors look for different types of Doji patterns to make the best profitability decisions during a period of a trend reversal.
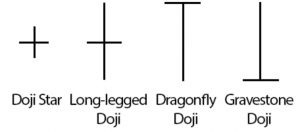
When the higher and lower shadows of the candlestick for a particular security are much longer in comparison with the regular pattern arrangement, the resulting graphic is referred to as the long-legged Doji.
A gravestone Doji pattern appears when the opening price is visible at the end of the day and comes back to its original range by the close of the day. The gravestone Doji at different points in a trend may be interpreted in different ways.
While it is a shooting star pattern at the top of the trend, it may be looked at in the form of an inverted hammer at the end of the day. When trade prices lower after opening and fall back to their original state at the end of the day, the resulting arrangement is a Dragonfly Doji pattern.
This variation of the Doji depicts itself as a hanging man pattern at the top of a trend and as a hammer candlestick at its bottom.
Doji Pattern Indicator
As explained above, the Doji pattern indicator comes from market indecision and the formation of the doji indicator can really vary among the ones shown below:
The formation can be a PLUS sign, can be a Cross, a T-sign or even an inverted T for that matter. There is a possibility that you might not find a body in the pattern and there could be shadows in these dojis with no definite length.
Larger shadows imply higher market volatility and smaller shadows mean low volatility.
If you really want to trust the Doji patterns, look for these patterns when these are accompanied with larger shadows.
Doji Pattern Scanner
Investors must be aware of key aspects of the Doji pattern to be able to make sound stock trading decisions.
First, investors first look for a Doji pattern in the support and resistance areas. Further, in the case of a short setup, an extended move to the upside is significant. In the case of a long set up, an extended move to the downside makes sense.
As an example, considering the fact that this pattern was formed in a support area, it may make sense to assume that this area may turn into a resistance area, leading to a short setup.
A stock trader may want to predict whether the pattern is going to the downside or the upside. To determine the best possibility of a win, a lower time frame must be considered. This helps to find out whether the stocks traded up or down on the following day.
To sum it all up, the indecision showed by a Doji pattern clearly states that the market was controlled neither by the bulls nor by the bears. Buying and selling forces are perceived to be at equilibrium in this case.
Price fluctuations are apparent throughout the day and a reversal trend often precedes the Doji pattern. As trading continues, the Doji pattern may manifest as either a bearish or bullish reversal candlestick.
Doji patterns serve as helpful tools for clever stock traders, helping them exit a certain trade prior to the end of a price move, or resume a favourable trend as soon as it kicks into action.
In case you are thinking of getting started with stock market investments or trading, let us assist you in taking the next steps forward:
More on Share Market Education
In case you are looking to learn more about Chart Patterns, here are some reference articles for you:


